A rising S&P 500 does not mean most stocks are rising. When a small group of large technology companies supplies much of the index’s gains, the headline...
S&P 500 Market Breadth: Are a Few Tech Stocks Masking a Weaker Market?
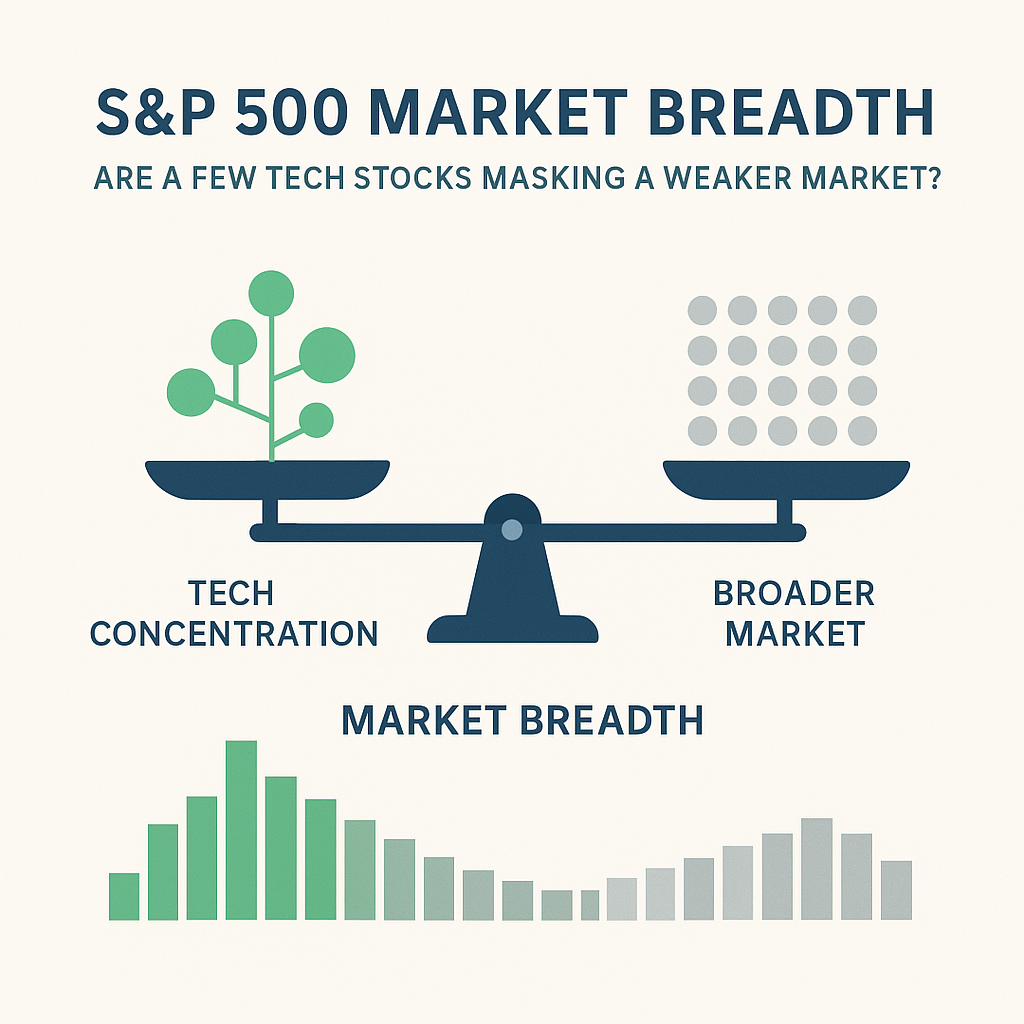
A rising S&P 500 does not mean most stocks are rising. When a small group of large technology companies supplies much of the index’s gains, the headline can look healthy while many constituent shares lag. That gap—between index performance and the experience of the typical stock—is the market-breadth problem investors should examine before changing a portfolio.
What Is S&P 500 Market Breadth?
Market breadth describes how widely gains or losses are shared across a group of securities. If most S&P 500 companies are advancing, breadth is broad. If a relatively small number of stocks account for a large share of the index’s rise while many constituents lag, breadth is narrow. The distinction matters because the S&P 500 is commonly treated as a quick read on the U.S. stock market, although its return is not the same thing as the return of the average company.
The index is market-capitalization weighted. In plain English, companies with larger market values carry more weight than smaller members. When a heavyweight stock climbs sharply, its contribution to the index is larger than an equally sized percentage move in a smaller constituent. The index is also not a census of every U.S. business: it represents selected large companies, and its composition changes under index rules. S&P Dow Jones Indices explains the benchmark’s construction and methodology in its S&P 500 overview and U.S. index methodology.
The news item prompting this discussion says gains from Nvidia, Micron, and a handful of other prominent technology stocks have helped support the S&P 500 while the broader picture looks less appealing. That is a claim about a particular market snapshot, not a permanent description of every trading day. Index levels, stock contributions, and breadth readings change. I would check the date and calculation behind any headline before treating it as a durable signal.
A useful distinction: index concentration is about how much the largest companies weigh in the benchmark; market breadth is about how many stocks participate in a move. They often interact, but they are not interchangeable. An index can be concentrated while breadth improves, or breadth can weaken even without one company dominating returns. Frankly, one headline cannot tell you which condition is present. Investors need the underlying numbers.
Common breadth measures include the number of S&P 500 stocks above a moving average, the advance-decline line, and the share of constituents that outperform the index. Each answers a different question, and each has limitations. A moving-average measure depends on the chosen period; an advance-decline count gives a small company the same vote as a large one; and relative performance can hide whether stocks actually rose or merely fell less. Look at more than one measure.
Why Breadth Matters—and What It Cannot Tell You
Breadth matters because it can reveal that a benchmark’s strength is uneven. If a portfolio owns a broad index fund, the investor still owns hundreds of companies, but the fund’s return can be driven disproportionately by its largest positions. Someone who sees a strong S&P 500 chart and assumes every sector is thriving may misread the condition of the market—and the concentration already present in their own holdings.
- It clarifies what is driving returns. A rising index powered by a narrow cluster tells a different story from one in which gains are spread across industries and company sizes.
- It exposes overlapping exposure. An investor may own an S&P 500 fund, a technology fund, and individual chip stocks, then discover that all three lean on the same companies. The number of funds in a portfolio does not prove diversification.
- It encourages better risk management. Knowing which holdings drive results can help investors judge whether their portfolio depends too heavily on a single theme, industry, or group of firms.
- It keeps performance comparisons honest. A capitalization-weighted index and an equal-weighted index can behave differently because they assign different importance to each constituent.
- It can temper overconfidence. A strong benchmark return does not guarantee that the next year will be strong or that every stock is reasonably priced.
Here is the contrarian point: narrow breadth is not automatically bearish. A few successful companies can lead for a long time because their earnings, cash flow, or competitive position are genuinely strong. Nor does an equal-weighted index beating a capitalization-weighted one prove that small or average-sized stocks are about to take over. Market leadership changes irregularly, and a breadth indicator is descriptive before it is predictive.
I have found that investors often confuse a useful warning with a precise forecast. Breadth can flag dependence on a small group; it cannot reliably tell you the date of a correction. A market may broaden, stay narrow, or fall before a popular indicator changes direction. Treat breadth as a portfolio diagnostic, not a trading bell.
The link to Asset Allocation is straightforward. A household’s mix of stocks, bonds, and cash should reflect its goals, spending needs, time horizon, and ability to tolerate losses. Diversification across asset classes and sectors can reduce reliance on one outcome, though it cannot eliminate market risk. FINRA’s guide to asset allocation and diversification explains why spreading investments across different types of assets matters. Investor.gov also describes diversifying investments. Neither source promises protection from every loss. No honest one does.
How to Assess Concentration and Respond
The sensible response is not to dump a broad index fund because a headline sounds ominous. First establish what you own, what risk you mean to take, and whether the portfolio still serves its purpose. When I review a portfolio, I start with exposures and goals, not a prediction about next week’s market.
- Check the date and claim. Confirm whether the story refers to daily, year-to-date, or longer-term performance. A few sessions can produce a striking headline without changing a long-term investment case. Find out whether “masking” refers to index contributions, the number of advancing stocks, or another measure.
- Look at more than the headline index. Compare the S&P 500 with an equal-weighted version, a total-market benchmark, and relevant sector indexes. These are not interchangeable investments: each uses a different construction and may carry different costs, risks, and exposure to smaller firms. The comparison is a diagnostic, not a contest with a permanent winner.
- Inspect breadth measures in context. You might review the share of constituents above a 50-day or 200-day moving average, the advance-decline line, and the number of stocks beating the index over a chosen period. Avoid treating a single threshold as a buy or sell instruction. Different periods can tell different stories, especially during sharp market reversals.
- Map your actual holdings. List each fund and individual stock, then examine its largest positions and sector weights. Add exposures across accounts where practical. If an S&P 500 fund, a technology ETF, and a semiconductor holding all own or depend on the same names, your portfolio may be more concentrated than the account list suggests.
- Compare the exposure with your plan. Ask whether the concentration is intentional and whether you could tolerate a substantial decline without selling at the worst time. A long time horizon can support more stock-market risk, but it does not make losses pleasant or irrelevant. Near-term spending money generally should not rely on shares behaving well on schedule.
- Rebalance by rule, not mood. If your target allocation has drifted, consider restoring it according to a written schedule or tolerance band. Rebalancing can involve taxes, fees, and trade-offs, so review account type and local tax rules before acting. It is not a guarantee of a profit; it is a way to keep portfolio risk closer to the plan.
- Keep costs and taxes in view. Switching funds based on a short-term leadership call can create transaction costs, taxable gains, and the risk of missing a recovery. Compare expense ratios and fund structures, and avoid turning a long-term portfolio into a string of reactions.
- Write down the reason for any change. If the reason is “I want to reduce a known, excessive exposure,” that can be a coherent portfolio decision. If the reason is “the market feels wrong this week,” pause. A written policy is boring, which is precisely why it can help.
The goal is not to own every market winner in advance. That is impossible. The goal is to own a portfolio whose Asset Allocation, Diversification, and Risk Management fit your real obligations. Investing is stewardship of resources earned through work and often intended to support family, future needs, and the wider community. That calls for care, not panic—or a wager disguised as certainty.
S&P 500 vs. Equal-Weight S&P 500
The most useful direct comparison for a concentration discussion is the traditional capitalization-weighted S&P 500 versus an equal-weighted version of the same broad group. One gives companies weight according to market value; the other resets constituents to roughly equal weights at rebalancing. The table describes structural differences, not current returns. Those figures change, and no fixed performance claim should be inferred from the design alone.
| Feature | S&P 500, capitalization weighted | S&P 500 Equal Weight |
|---|
| Weighting approach | Larger market values receive larger index weights | Constituents receive roughly equal weights at rebalancing |
| Influence of mega-cap technology shares | Can be substantial when the largest firms are tech companies | Reduced relative to the standard index, though tech remains represented |
| What it helps measure | Performance of large U.S. companies weighted by market value | Performance of the same broad company group with less emphasis on the largest firms |
| Concentration profile | More sensitive to the performance of the biggest constituents | More balanced across constituents, but not free of sector or stock risk |
| Portfolio implication | May suit investors seeking a market-cap-weighted large-company benchmark | May suit investors who want a different weighting method and accept its trade-offs |
| Important limitation | Headline returns can obscure weak participation among smaller constituents | Rebalancing and different weights can cause it to lag when mega-caps lead |
The equal-weighted alternative is not automatically safer or better. It reduces the weight of the largest stocks but increases the relative weight of smaller constituents in the index and generally requires periodic rebalancing. That can create a different pattern of sector exposure and turnover. Results may diverge for years, and either approach can lead during particular periods.
The standard S&P 500’s weighting method is a feature, not a defect. It reflects the market value of its constituents and is widely used as a benchmark. But a fund tracking it should not be mistaken for an equal-dollar bet on 500 companies. If the largest few names account for a meaningful fraction of the index, their earnings news and share-price swings can influence a fund’s result more than the performance of many smaller members combined.
When I compare the two, I ask what question the investor is trying to answer. “How did large U.S. companies perform according to market value?” points toward the standard index. “How did a similarly broad group perform with less weight on its biggest names?” points toward equal weighting. Neither answers, “What will outperform next?” That question has no dependable short-cut.
Common Mistakes to Avoid
Mistake 1: Assuming the headline index represents the typical stock. The S&P 500 is a weighted benchmark. Its return can diverge from the median constituent’s return, so do not use the index alone as a summary of every company’s experience. Check breadth and weighting before drawing conclusions.
Mistake 2: Treating narrow leadership as proof of an imminent crash. Concentration is a real portfolio risk, but it does not supply a countdown clock. The largest stocks may continue to rise, and breadth can improve without a dramatic reversal. Selling everything on a single indicator turns uncertainty into a costly bet.
Mistake 3: Assuming a fund with hundreds of holdings is automatically diversified. A fund may own many companies yet assign a large portion of its assets to a small group. And several funds can hold the same stocks. Look through the labels to the underlying positions; the number printed on a fact sheet is not a risk analysis.
Mistake 4: Chasing the apparent winner. After technology shares lead, investors may pile into a sector fund or individual stocks because recent charts look compelling. That can add concentration at the moment when optimism is already high. Past returns tell you what happened, not what you should pay today.
Mistake 5: Believing equal weighting removes risk. Equal weighting changes exposure; it does not erase market declines, business failures, or valuation risk. It may reduce reliance on mega-caps while increasing exposure to smaller constituents, and its results can lag when the largest companies surge. Every weighting rule makes trade-offs.
Mistake 6: Confusing diversification with owning a little of everything. A portfolio of many funds may still concentrate in the same sectors, regions, or risk factors. Diversification means spreading exposure across investments that do not all respond in the same way—not collecting ticker symbols like souvenirs.
Mistake 7: Ignoring valuation, costs, and taxes. A stock can be an excellent business and still be priced for unusually high expectations. A fund can provide a useful exposure and still carry costs worth comparing. Selling appreciated holdings can also create tax consequences. Those details belong in the decision, not in the footnotes after the trade.
Mistake 8: Reacting without an investment policy. A portfolio changes for good reasons: a new goal, a shorter time horizon, a major change in income, or a risk level that no longer fits. A frightening headline alone is weaker evidence. Write down target allocations, rebalancing rules, and the conditions that would justify a change. Then consult a qualified financial or tax professional when the decision is complex.
Frankly, much bad investing advice offers emotional relief while creating a new problem. “Get out before it falls” sounds useful until the investor must decide when to buy back in. “Just hold forever” is not a complete plan either; people have expenses and changing circumstances. Sound judgment means balancing patience with periodic review.
Frequently Asked Questions
What does narrow market breadth mean?
It means a relatively small share of stocks is driving a market advance, while many other shares are flat or declining. It is a description of participation, not a prediction that prices must fall. Investors should check which breadth measure is being used and the period it covers.
Can a few technology stocks really move the S&P 500?
Yes. The S&P 500 is market-capitalization weighted, so larger constituents have more influence on its return than smaller ones. If some of the largest companies rise sharply, they can materially support the index even when many constituents lag. The amount of influence depends on their weights and performance at that time.
Is the equal-weighted S&P 500 safer than the regular S&P 500?
Not in every sense. Equal weighting reduces dependence on the largest constituents, but it does not remove stock-market risk and may increase the relative influence of smaller companies. It can outperform or underperform the traditional index over different periods. “Safer” depends on the risk an investor is trying to reduce.
Should I sell my S&P 500 fund if market breadth is weak?
Weak breadth alone is not a reliable reason to sell. Review your goals, time horizon, full portfolio exposure, and ability to tolerate losses. If the fund creates more concentration than you intended, a planned adjustment may make sense; base it on your investment policy and tax situation, not a single headline or indicator.
Final Thought
A market index is a measuring tool, not a promise that every stock—or every investor—shares the same result. When Nvidia, Micron, or other large technology companies lead, the S&P 500 can post gains even if participation is thin. That deserves attention, particularly if a household owns several funds and individual shares that lean on the same businesses. It does not justify pretending that tomorrow’s market direction is obvious.
Start with what can be checked: how the index is weighted, what its largest positions are, whether gains are broadly shared, and how those facts compare with your own portfolio. Then measure them against a sensible plan. A broad fund may remain an appropriate core holding for one investor and an excessive concentration for another; the name of the benchmark cannot make that judgment for you.
I would rather see an investor understand a deliberate allocation than chase a fashionable forecast. Keep an emergency reserve suited to your circumstances, diversify thoughtfully, account for fees and taxes, and rebalance when your rules call for it. If a change in exposure is warranted, make it for a reason that will still make sense after the headline disappears. The market will provide plenty more headlines. Your financial decisions do not need to follow every one.
