October 2026 Jobs Report: 165,000 Jobs Added as Rate-Hike Odds Rise
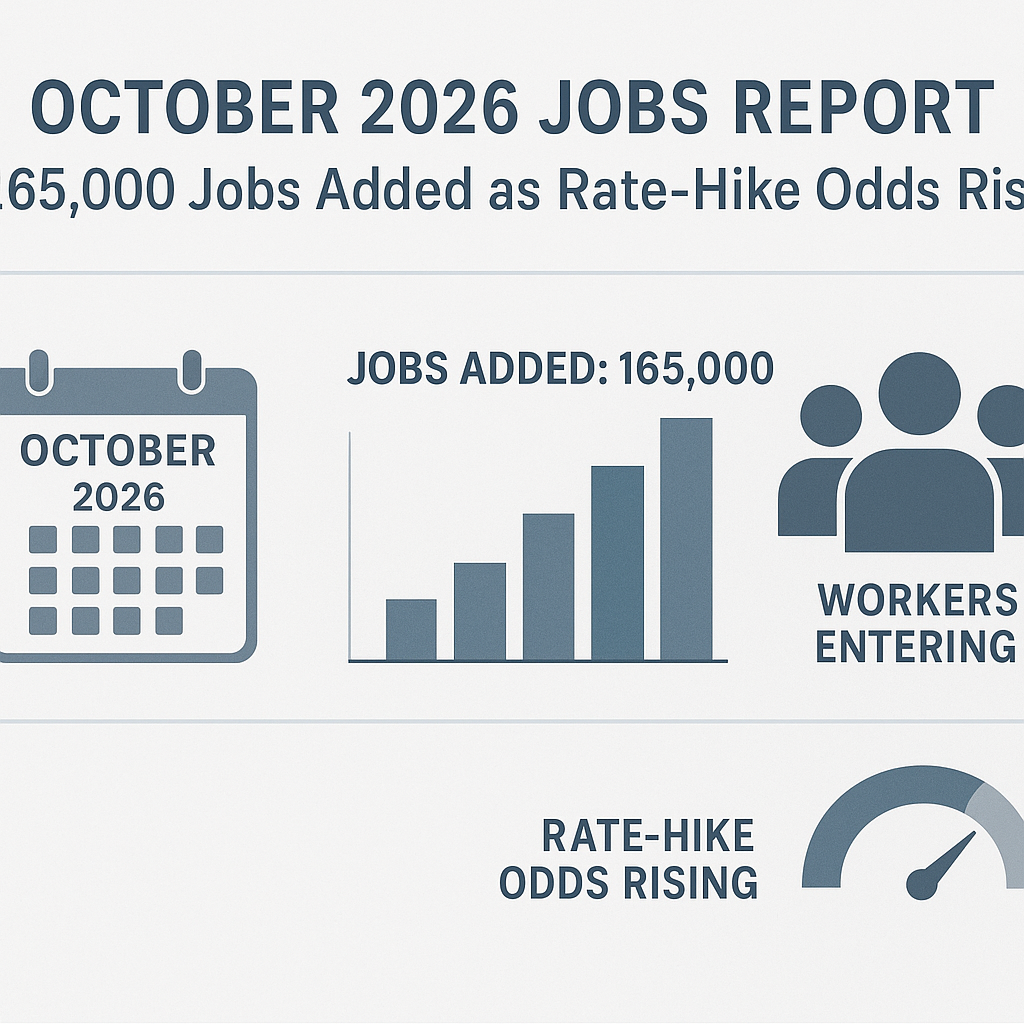
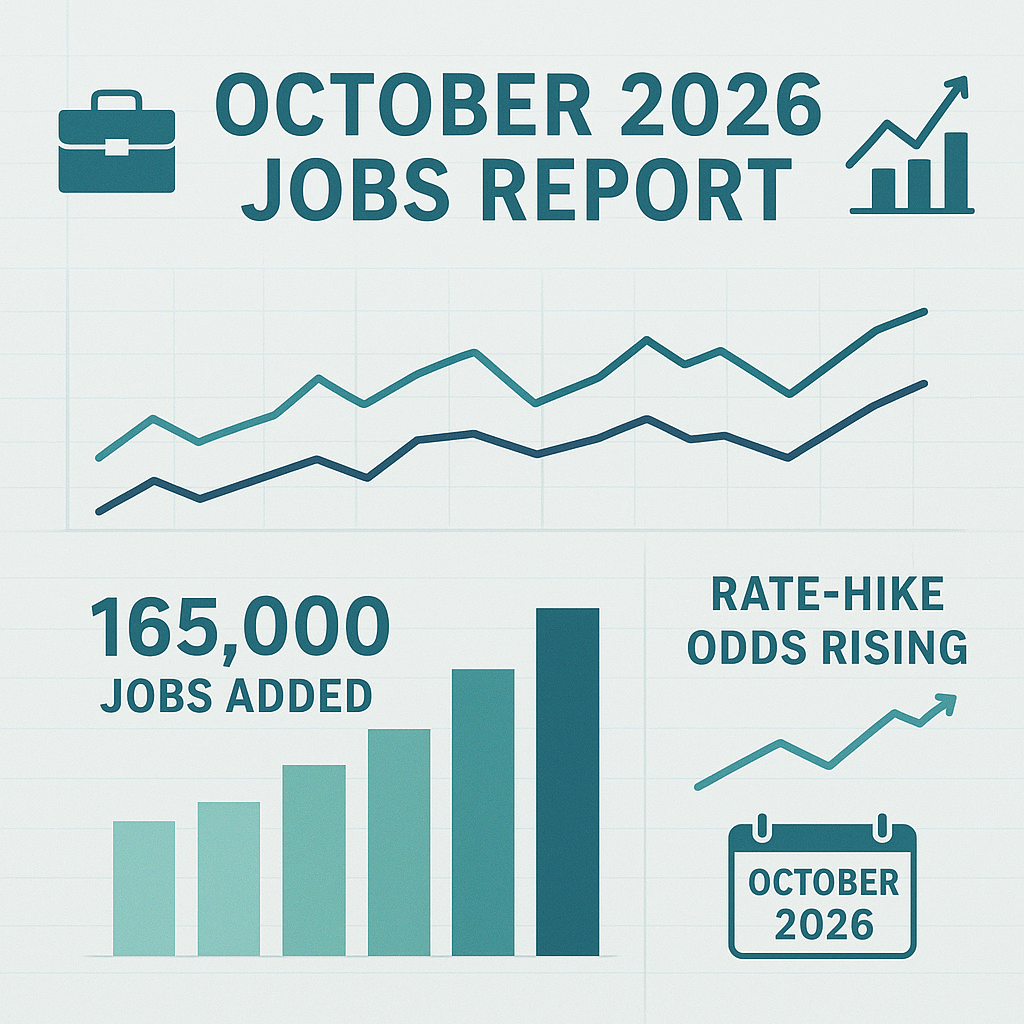
The October 2026 jobs report showed employers adding 165,000 jobs, far above economists’ 65,000 estimate, while unemployment edged down to 4.1%. Upward revisions to August and September strengthened the picture, though rising involuntary part-time work and a Federal Reserve rate-hike repricing complicate the headline.
The report offers a firmer picture of hiring than September’s initial estimate suggested, but one strong month does not settle the outlook for workers, inflation, or interest rates. Payroll growth, unemployment, wage gains, and the number of people stuck in part-time work each tell a different part of the story. Read together, they point to resilient hiring alongside some persistent strains.
That distinction matters to households and investors. A sturdy labor market can support consumer spending and company revenues, while stronger wages and job growth may also affect the Federal Reserve’s judgment about whether borrowing costs should rise. Frankly, the useful question is not whether this report was “good” or “bad.” It is what the details say about momentum—and what they cannot tell us yet.
What is the October 2026 jobs report?
The October jobs report is the U.S. government’s monthly account of employment conditions, published by the Bureau of Labor Statistics (BLS). It combines two surveys that measure related but different things: a survey of employers, which estimates payroll jobs and earnings, and a survey of households, which measures unemployment and labor-force participation. The BLS explains its measures and methods in its Employment Situation release and Current Population Survey guide.
Those surveys should not be treated as interchangeable. The payroll count measures jobs reported by employers; the unemployment rate measures people who are unemployed and actively seeking work as a share of the labor force. One person can hold more than one payroll job, while a person without a job is not automatically counted as unemployed if they are not actively looking. Differences between the two measures can therefore occur without either number being a mistake.
The October release reported a 165,000 increase in payroll employment and a 4.1% unemployment rate. Economists polled by LSEG had expected 65,000 new jobs and an unemployment rate of 4.2%. The gap between the actual figures and those estimates made the report a clear upside surprise, but forecasts are not official targets or promises. They are estimates that reflect what economists knew before the release.
Revisions are another essential part of the monthly picture. The BLS revised August from a 133,000 gain to 186,000, and September from 29,000 to 60,000. Together, those two months were 84,000 stronger than previously reported. Revisions can change the story about recent momentum, but they also remind readers that an early payroll estimate is not the final word. I would read the three-month sequence—not October alone—as the better starting point for judging direction.
What the October figures say about hiring
The headline is strong. October’s 165,000 payroll increase was more than twice the 65,000 economists polled by LSEG had forecast, while the upward revisions lifted August and September by a combined 84,000. That combination suggests hiring was firmer over the recent period than the first estimates implied. It does not, by itself, prove that every industry or worker group is enjoying the same improvement.
Private employers added 159,000 jobs in October, compared with an LSEG expectation of 64,000. Government payrolls increased by 6,000. Within government, federal employment fell by 1,000, state governments added 8,000, and local governments cut 1,000 positions. September’s government payroll decline was revised from 17,000 to 18,000. These distinctions matter: a positive total can contain both expanding areas and areas still reducing staff.
The unemployment rate slipped from the expected 4.2% to 4.1%. That is a favorable signal, but a single tenth of a percentage point should not be mistaken for a wholesale change in employment security. The household survey can move differently from payroll counts, and the rate does not show whether people found full-time work, whether their hours increased, or whether they have been searching for months.
Pay also came in stronger than forecast. Average hourly earnings rose 0.4% from September and 3.1% from a year earlier; LSEG economists had expected increases of 0.3% and 2.4%, respectively. Faster pay growth can help workers meet expenses and support spending. It can also draw the Fed’s attention, because wage growth is one part of the broader picture policymakers consider when assessing inflation pressures. The report does not say how much of the pay gain translates into improved purchasing power; that depends on price changes, taxes, hours worked, and household circumstances.
The market reacted positively at first: the S&P 500 rose 0.65% during Friday morning trading. That move indicates how investors responded during that session, not how the index finished the day or how markets will behave after later economic releases. A strong employment report can support company earnings expectations, but it may also raise concern that interest rates will stay higher or rise. There is the kicker: the same number can be good news for demand and a complication for borrowing costs.
Which sectors gained or lost jobs?
Several private industries recorded sizable October gains. Professional and business services added 70,000 jobs, well above its average monthly increase of 15,000 over the previous 12 months. Professional, scientific, and technical services contributed 32,900 of those positions, while administrative and support services, including waste management and remediation, contributed 28,100. That is a marked monthly jump; one month does not establish a lasting hiring trend.
Healthcare added 41,600 jobs, compared with an average monthly gain of 31,000 over the previous year. Hospitals added 16,000, home healthcare services gained 10,500, and outpatient care centers added 4,800. Healthcare’s continued hiring can reflect sustained demand for care, but the report provides employment counts, not an explanation of the forces behind every hire or vacancy.
Transportation and warehousing added 24,800 jobs. Couriers and messengers accounted for 17,400, while air transportation added 3,500. Manufacturing added 19,000, topping the 5,000 gain economists had expected; September manufacturing growth was revised from 9,000 to 13,000. These results point to gains in several different lines of business, rather than a jobs increase confined to one industry.
Government employment rose by 6,000 overall, but the state and federal figures moved in opposite directions: state payrolls expanded by 8,000, federal payrolls contracted by 1,000, and local government employment fell by 1,000. Readers should not assume a sector’s latest change describes every occupation within it. Manufacturing includes a range of industries and roles, just as healthcare includes hospitals, home care, and outpatient providers with different staffing needs.
The listed industry gains also do not add up to the entire private-sector change. They are selected sector figures, not a complete breakdown of every private employer, and the report describes other industries too. That is worth remembering when comparing the large headline numbers. A sector can be a significant contributor without accounting for all payroll growth, while a small gain or decline can still matter to the people and communities directly affected.
What does the report mean for workers?
The broader workforce measures show why a low unemployment rate does not tell the whole story. The number of people unemployed for 27 weeks or longer stood at 2 million in October and changed little over the month. They represented 27.6% of all unemployed people. Long job searches can make it harder to maintain income and professional momentum, even when the overall payroll count is rising.
Part-time work for economic reasons increased by 339,000 to 4.8 million. These workers wanted full-time jobs but either had their hours reduced or could not find full-time work. This measure is not the same as all part-time employment: it focuses on people who would prefer more hours. The rise is a caution against reading the headline payroll gain as proof that every new or continuing job provides the hours workers want.
The labor-force participation rate was 61.9%, and the employment-population ratio was 59.3%. Both changed little in October and have shown little net change since January. Participation describes the share of the population working or actively looking for work; the employment-population ratio describes the share that is employed. Neither measure tells us on its own why people are outside the labor force or whether a job matches a person’s skills and needs.
For workers, then, the report mixes encouraging and less comfortable signals. Hiring was stronger than expected, the unemployment rate edged down, and wage growth beat forecasts. At the same time, long-term unemployment remained substantial and involuntary part-time work jumped. A person assessing the job market for a career move should look beyond the national number to their occupation, local employers, expected hours, benefits, and pay after inflation.
There is a human point behind these measures. Employment is not merely a payroll entry; stable work affects a household’s ability to plan, care for family members, and contribute to a community. Investors should remember that labor costs and productivity are not abstract spreadsheet items either. Responsible stewardship considers returns alongside the people whose work produces them.
Why could the report affect Federal Reserve rates?
The October report raised market expectations that the Federal Reserve could increase interest rates at its December 8–9 meeting. The CME FedWatch tool showed a 76.8% probability of a 25-basis-point hike on Friday, up from 66.9% a week earlier. If a quarter-point increase occurred, the federal funds target range would move to 4.00%–4.25%, according to the figures reported with the release. A probability reading is not a decision, and it can change as new information arrives.
The Fed considers employment alongside price stability when setting monetary policy. Stronger-than-expected job growth, lower unemployment, and wages rising faster than the poll forecast may give policymakers reason to ask whether demand and pay are putting more pressure on prices. But this jobs report does not itself establish that inflation is rising, nor does it reveal what the Fed will decide. Officials assess a broader set of data and risks before changing the policy rate. The Fed outlines its policy process through its Federal Open Market Committee information.
Higher policy rates can affect borrowing costs across the economy, although not every loan or bond rate moves in lockstep with the federal funds rate. They can influence short-term financing, expectations for future rates, and the return investors demand on some assets. For households, the effect can show up in financing costs and savings yields; for businesses, it can change the cost of investment and debt. The actual impact depends on the product, lender, timing, and market conditions.
The rate outlook also creates a trade-off for markets. A resilient labor market can support consumer demand and corporate revenue, while the prospect of tighter monetary policy can weigh on asset valuations or financing plans. That does not mean the S&P 500’s 0.65% morning rise predicts its next move. Investors price expectations, and those expectations can shift quickly when inflation, employment, or Fed communications surprise them.
Seema Shah, chief global strategist at Principal Asset Management, called the report “a strong rebuttal to fears that the economy is heading into a meaningful slowdown.” Lindsay Rosner, head of multi-sector fixed income investing at Goldman Sachs Asset Management, said the payroll number “removed the traffic light at the December intersection for the Fed.” Those are assessments of what the data might mean, not announcements from policymakers. The official decision belongs to the FOMC, not the market or any single analyst.
How should readers interpret the report?
- Separate the surveys. Payroll growth and unemployment come from different surveys, with different definitions and coverage. A strong payroll number alongside a modest move in the unemployment rate is not automatically a contradiction. Check which measure is being discussed before drawing a conclusion.
- Read the revisions alongside the latest estimate. August and September were revised higher by a combined 84,000 jobs, changing the recent hiring picture. Revisions can make a trend look stronger or weaker than the first estimate suggested, so compare several months instead of treating one release as a verdict. The BLS Employment Situation table of contents provides access to the report’s detailed tables.
- Look beyond the headline. Sector gains show where the reported employment changes occurred; hours and full-time status help explain job quality. In this release, professional and business services, healthcare, transportation and warehousing, and manufacturing added jobs, while the number of people working part-time for economic reasons rose. Both sides belong in a fair reading.
- Distinguish forecasts from outcomes. LSEG estimates helped frame the surprise, but they are not measures of what the economy “should” have produced. The actual payroll increase beat the estimate by 100,000. That difference can affect market expectations, yet it does not tell us whether future hiring will repeat the same result.
- Treat market probabilities as probabilities. The CME FedWatch tool translates futures-market pricing into estimated odds of policy outcomes; it does not report a promised Fed action. Readers can consult the CME FedWatch Tool, but should not confuse a 76.8% probability with certainty. A release, speech, or meeting can change the estimate.
- Match the numbers to the decision. A job seeker needs local hiring, wage offers, and work hours. A business owner may care more about available workers and labor costs. An investor may focus on earnings, interest-rate expectations, and portfolio exposure. The same report can matter differently depending on the question being asked.
I would avoid making a major financial decision from one monthly employment release. Use it as one input alongside your time horizon, cash needs, debt costs, portfolio diversification, and risk tolerance. If a report changes your view of interest rates, check whether your plan actually depends on a particular rate path—or whether you are reacting to a noisy headline.
October report vs. September’s initial report
The clearest comparison is October’s result against the initial September estimate and the revisions that followed. The table below keeps the reference points separate: October’s reported change is not the same as September’s revised result, and the LSEG estimates are forecasts, not official BLS figures.
| Measure | October 2026 report | September 2026 initial estimate / later revision |
|---|
| Total payroll change | +165,000 | +29,000 initially; revised to +60,000 |
| Economists’ payroll estimate | +65,000 | Not reported here |
| Unemployment rate | 4.1% | October report says the earlier expectation was 4.2%; September rate not reported here |
| Private payroll change | +159,000 | Not reported here |
| Government payroll change | +6,000 | −17,000 initially; revised to −18,000 |
| Manufacturing jobs | +19,000 | +9,000 initially; revised to +13,000 |
| Average hourly earnings | +0.4% month over month; +3.1% year over year | Not reported here |
August also matters to the comparison: its payroll gain was revised from 133,000 to 186,000. Together, the August and September revisions added 84,000 jobs to the previously reported figures. This gives the recent trend a stronger starting point than September’s first estimate alone would suggest.
The table also shows what cannot responsibly be compared from the figures available here. No September unemployment rate, private-payroll figure, or earnings growth rate is included, so filling those cells with guesses would create false precision. Frankly, an honest “not reported” is more useful than a tidy but invented comparison. For full historical detail, use the BLS tables rather than stitching together figures from separate headlines.
Common mistakes to avoid
Mistake 1: Treating a forecast miss as proof of a new trend. October beat the LSEG jobs estimate by a wide margin, but an estimate is a forecast, not the baseline the economy must meet. One surprising month can be followed by a softer one. Revisions and subsequent reports will help establish whether hiring has shifted direction.
Mistake 2: Treating the unemployment rate as the entire labor market. At 4.1%, unemployment was below expectations, but the rate does not summarize long-term unemployment, involuntary part-time work, wage quality, or participation. The 4.8 million people working part-time for economic reasons and the 2 million long-term unemployed are part of the employment story too.
Mistake 3: Assuming higher wages mean higher purchasing power. Average hourly earnings rose 3.1% year over year, but that figure alone does not account for changes in prices, taxes, household expenses, or the number of hours worked. Wage growth is important; it is not a complete measure of how far a paycheck goes.
Mistake 4: Reading a FedWatch probability as a promise. A 76.8% estimated chance of a hike is meaningful as a snapshot of market pricing, but it is not a vote, commitment, or guarantee. The Fed sets policy at its meetings after evaluating a range of information. Don’t build a household budget or portfolio around the assumption that one forecast must come true.
Mistake 5: Assuming every industry shares the headline strength. Professional and business services posted a large gain, while government payrolls contained gains and cuts at different levels. Sector averages do not describe each employer, job type, or location. A worker making a career choice should check the field and region that actually matter to them.
Mistake 6: Making a portfolio turn on a single morning’s market move. The S&P 500 gained 0.65% during Friday morning trading, but that short window is not a durable investment signal. A diversified portfolio should reflect goals and risk capacity, not a quick reaction to one employment report. Let the numbers inform your analysis; don’t let them make the decision for you.
Frequently asked questions
How many jobs were added in October 2026?
Employers added 165,000 jobs in October, according to the Bureau of Labor Statistics. That was above the 65,000 gain economists polled by LSEG expected. The report also revised August and September payrolls upward by a combined 84,000, making recent employment growth stronger than previously reported.
Why did the unemployment rate fall to 4.1%?
The October report placed unemployment at 4.1%, below the 4.2% rate economists expected. The reported figures do not identify a single cause for the monthly change. The unemployment rate is based on a household survey and a specific definition of people who are unemployed and actively looking for work, so it should be read alongside payrolls and other labor measures.
Does the jobs report mean the Fed will raise rates in December?
No. The report increased market expectations of a 25-basis-point increase, with the CME FedWatch tool showing a 76.8% probability on Friday, but the FOMC makes the decision. A market-implied probability can change as new data and policy comments arrive. The reported odds should not be treated as a confirmed rate move.
Which industries added the most jobs in October?
Professional and business services added 70,000 jobs, healthcare added 41,600, transportation and warehousing added 24,800, and manufacturing added 19,000. These are reported sector changes, not an exhaustive list of every industry’s result. Government employment rose by 6,000 overall, with state payrolls up and federal and local payrolls down.
The October report is encouraging evidence that hiring held up better than economists anticipated, and the revisions strengthen that reading. But the increase in involuntary part-time work, persistent long-term unemployment, and the still-flat participation measures deserve attention too. Investors and workers are better served by holding both truths at once than by choosing whichever headline fits a pre-existing view.
For investors, the practical response is measured rather than dramatic: check whether your portfolio and cash plan can withstand more than one interest-rate outcome, and avoid confusing a market probability with a policy promise. For workers, national payroll growth is useful context, not a substitute for local job information or a careful look at pay and hours. The report is a strong monthly signal, not a verdict on the year ahead. Good analysis keeps that distinction in view—and treats economic resources as something to steward, not gamble on a headline.